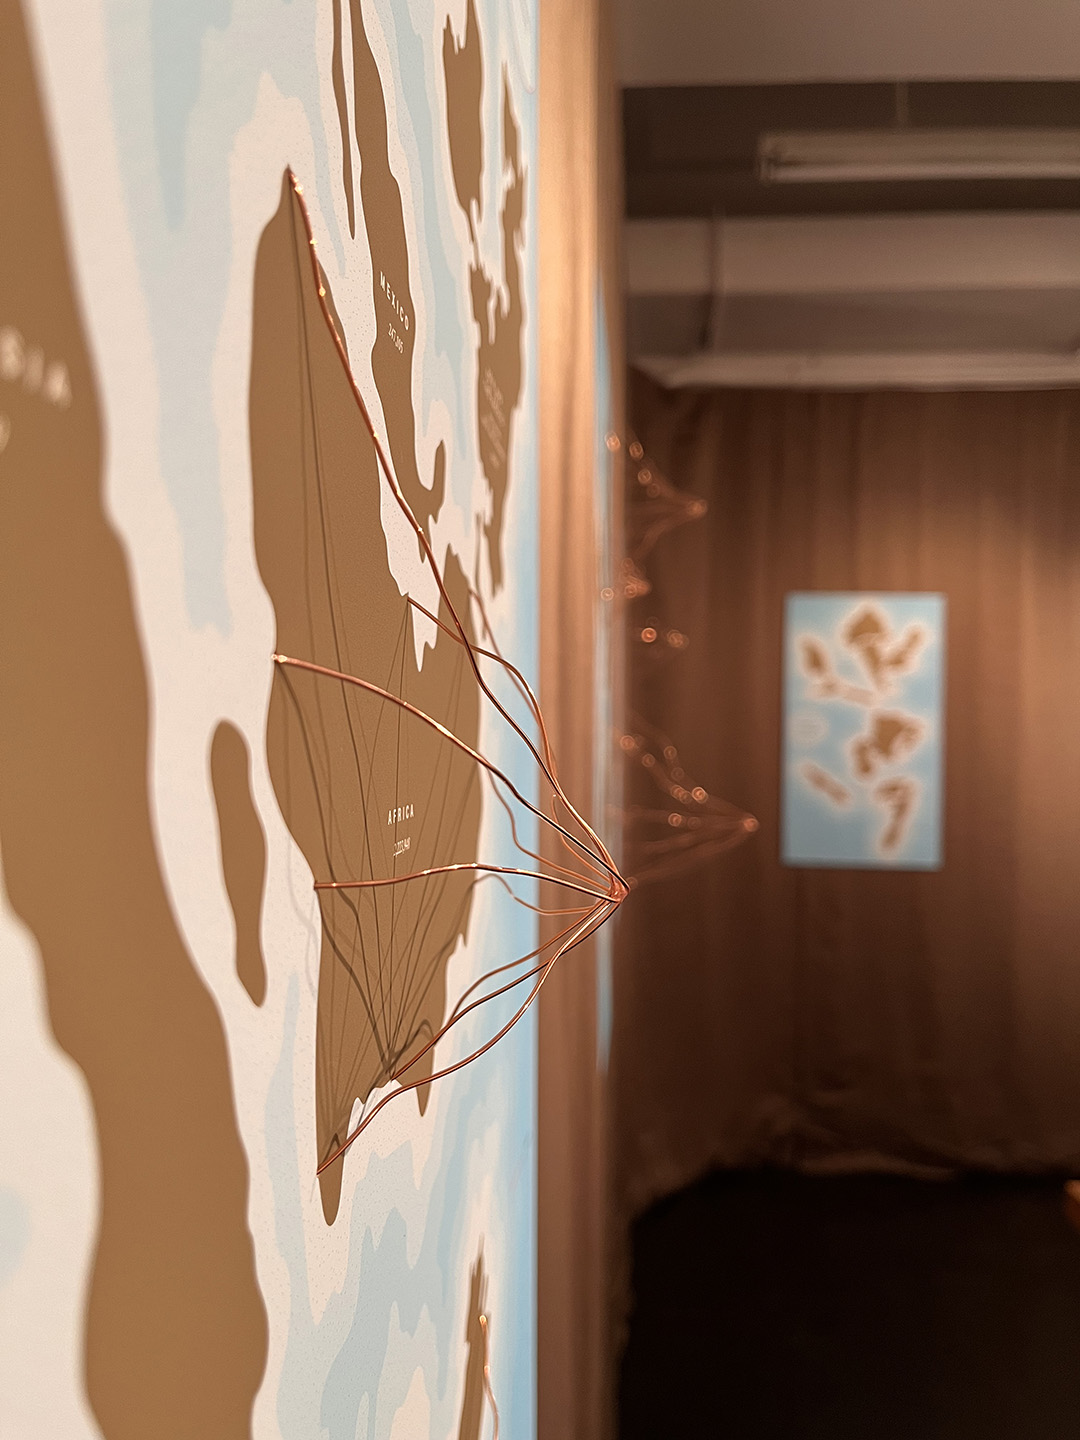
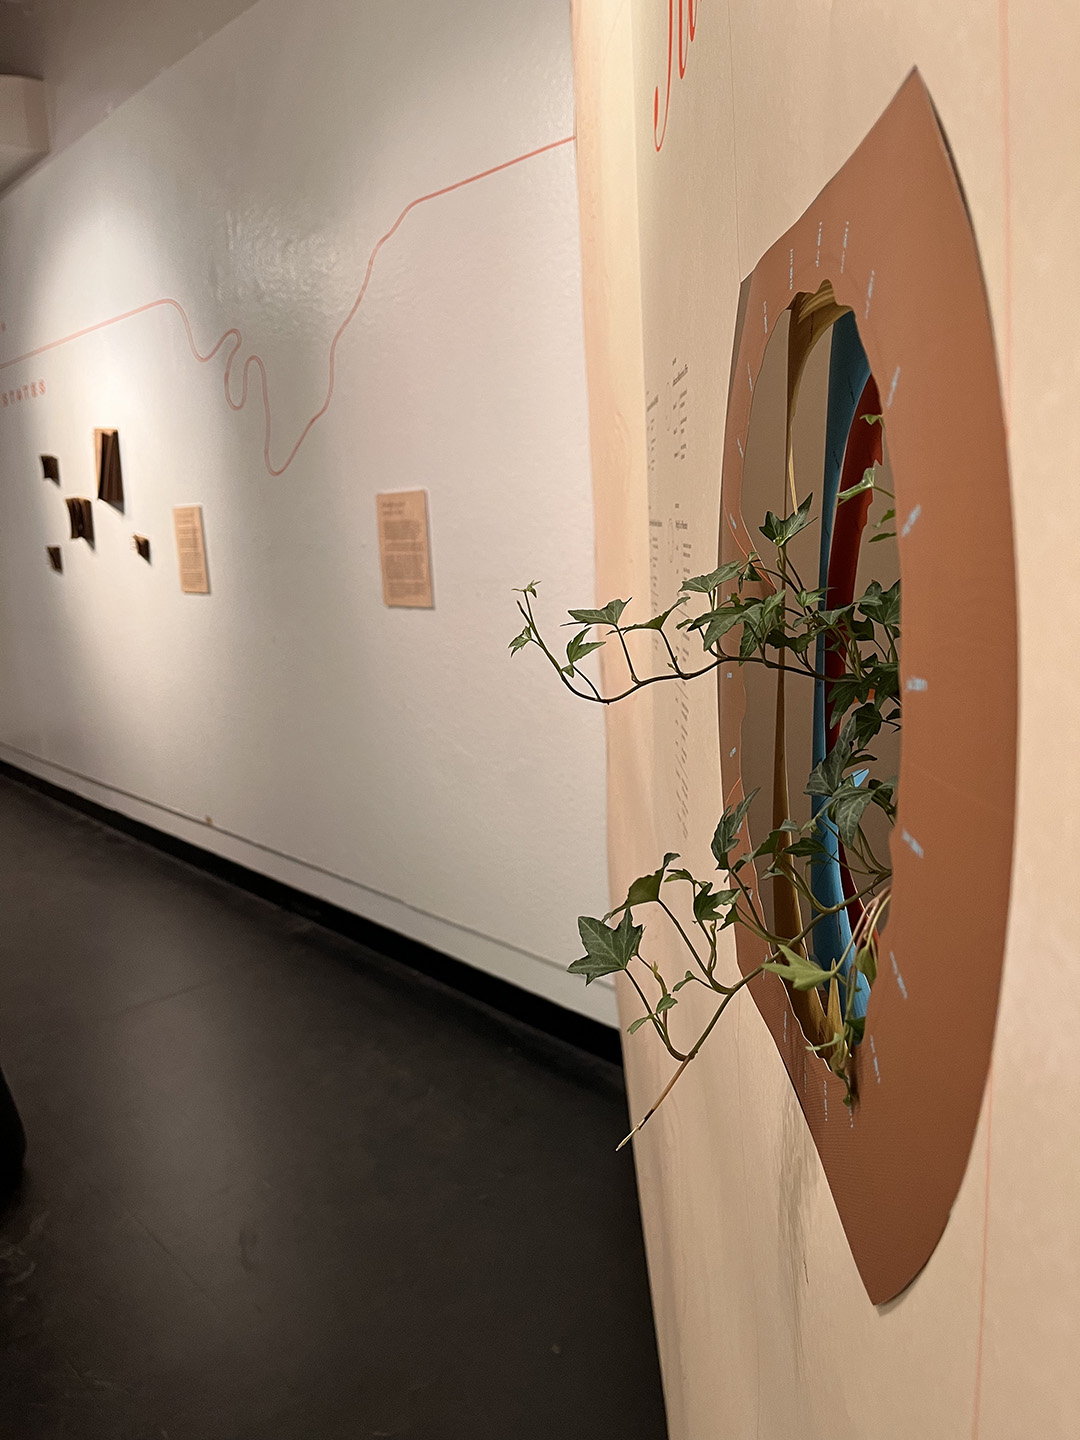
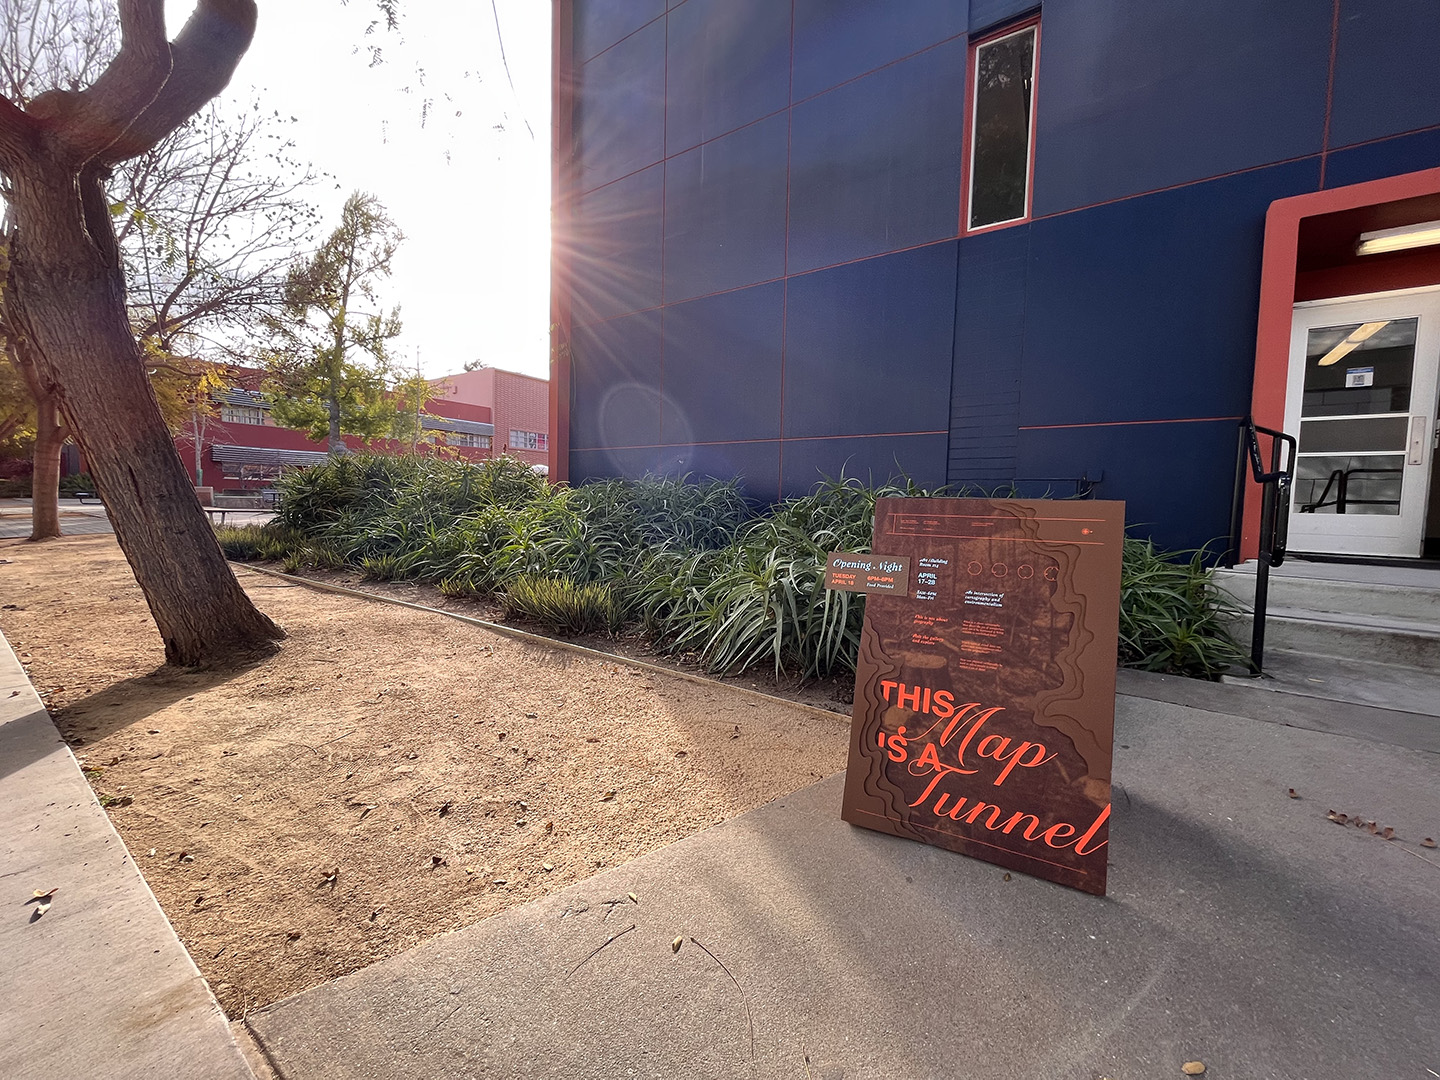
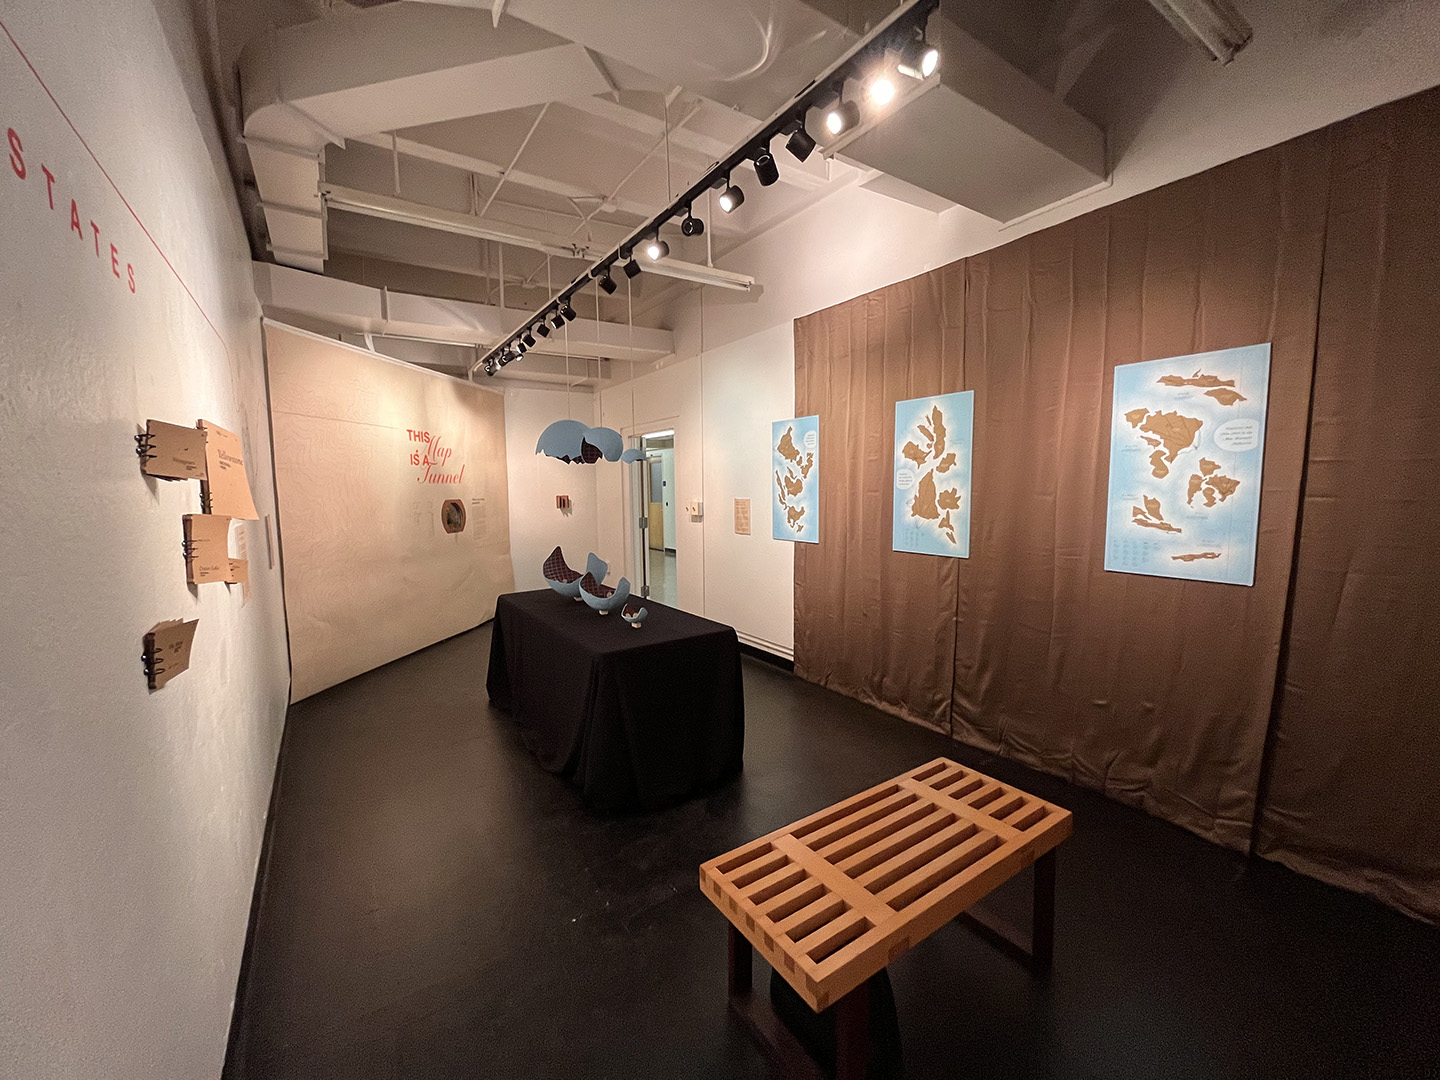
This exhibition attempts to intersect cartography with environmentalism, and use maps to show data other than the geographical.
Abstract
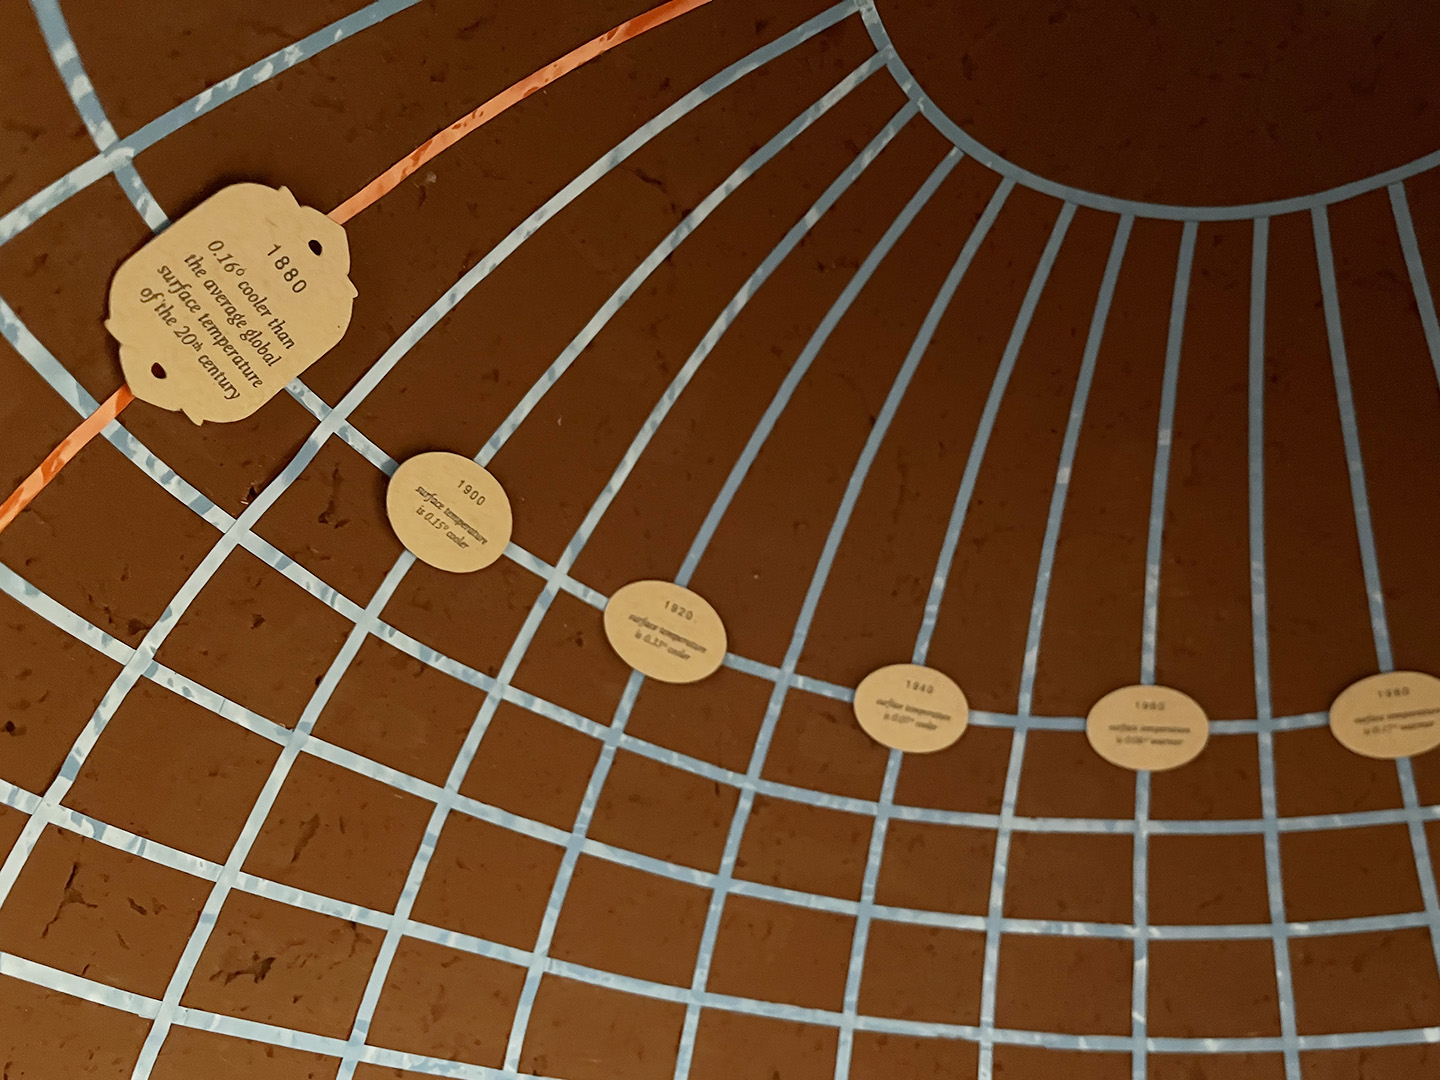
Maps have always been composed of both their function and their storytelling. The earliest cartographers were just as dedicated to the accuracy of their designs as they were to the implicit meaning hidden in the frames, naming conventions, and illustrations that gave the map its character: the extra details have always been just as important as the physical data in imbuing a sense of the space that they represent. There is emotion in every map because they are made to make us feel, to make us look a little closer, to make us wander. They position us in the world and ask us to question what we actually know about it. Is there a way, then, to strip out the existing data and leave the emotion? Can we apply it to information that isn’t geographic, and that requires the attention and nuance that a map commands? There is a deep inherent relationship between cartography and the environment, as mapping a space requires a respect for that space. Each of the exhibits featured in this exhibition create new geography based on real environmental data in an attempt to highlight issues from a new immersive perspective. This is not about geography. This is about using a map as a vehicle for communicating something else, and trying to bring the intricate details of an issue to the surface. Every map is a transportive tunnel, with layers of meaning to explore. Does it matter if the space is literal?
Thesis Statement
Map design has been considered the oldest form of data visualization, and its immersive power can surpass its traditional limitations to geographic data. The most successful way to showcase its many strengths is to highlight its relationship to the Earth using environmental data, and to test the boundaries of a map’s z-axis with a physical exhibition.

Research Questions
-
What is it about cartography that elicits the joy of wanderlust, and can it be harnessed to bring interest to data that is otherwise overlooked?
-
Which types of visual data can globes and maps represent other than the geographical?
-
How can spacial cartography be used to allow viewers to travel within a set of data?
Outcome
An exhibition that uses cartography design to highlight the nuances of natural issues like deforestation, overtourism, and energy usage.
Advisors
Connie Hwang–Primary Advisor
SJSU Professor, Graphic Designer
SJSU Professor, Graphic Designer
Joe Miller–Secondary Advisor
SJSU Professor, Graphic Designer
SJSU Professor, Graphic Designer
Kären Wigen–Tertiary Advisor
Stanford Professor, Cartography
Stanford Professor, Cartography
Process Book


